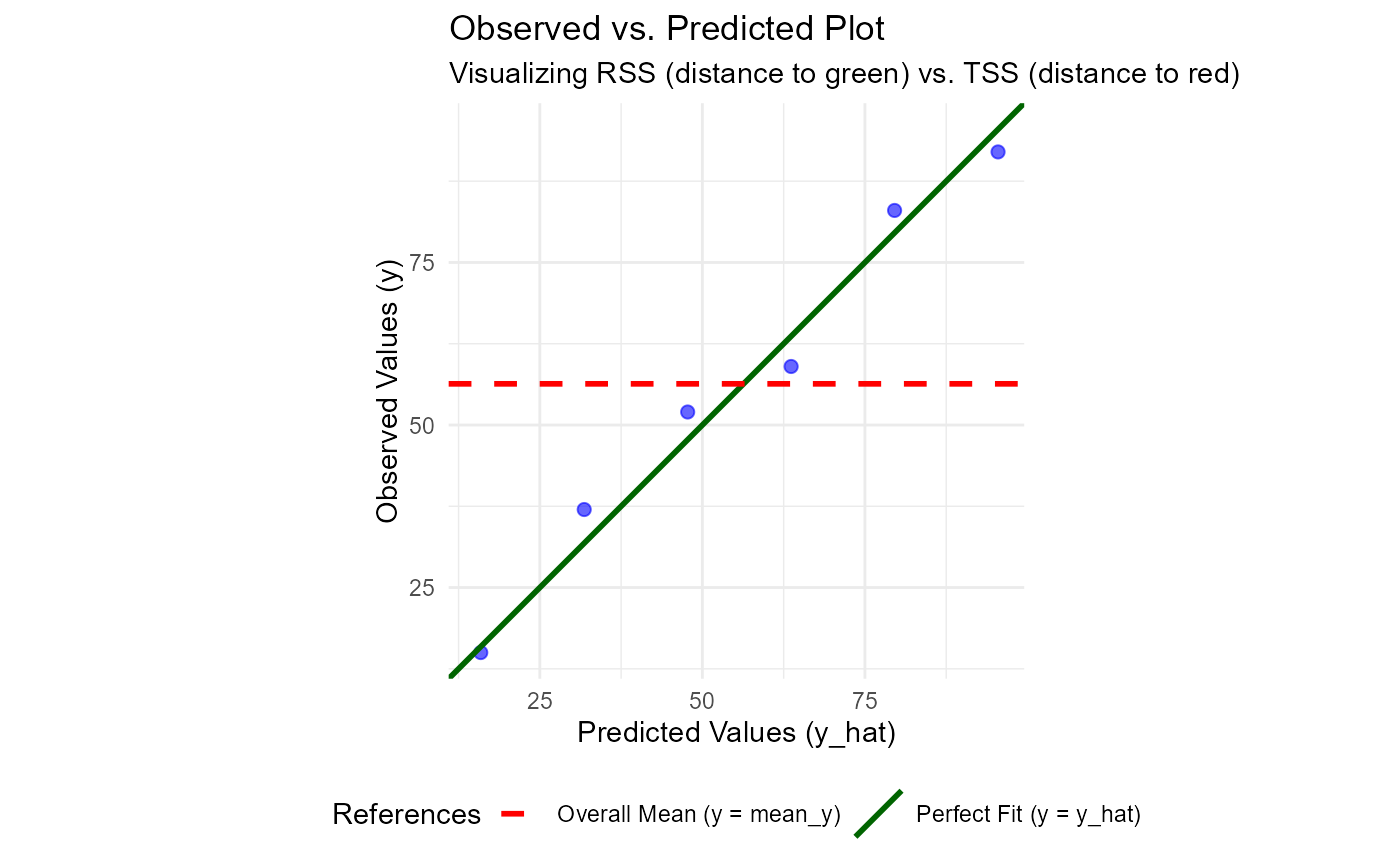
A diagnostic plot to visualize why R-squared might be low or negative. It compares the model predictions (identity line) against the mean (horizontal line).
Examples
df1 <- data.frame(x = 1:6, y = c(15, 37, 52, 59, 83, 92))
model <- lm(y ~ x - 1, data = df1) # No-intercept model
plot_diagnostic(model)